See also: Item and Score Response Distribution, View Student Responses
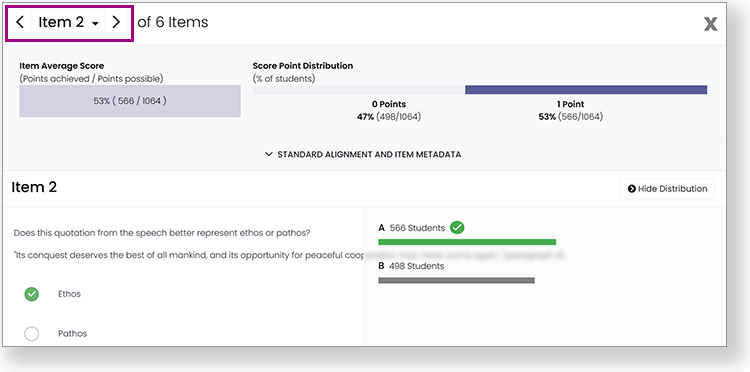
The Performance Report Item Analysis tab shows Item Details and provides an Item Performance Comparison. This tab is only available if the program is set up to use it. In both views, you can select an item number or an item cell to open a popup that shows item content, answers, average score, and score point distribution, if configured to be visible for this assessment.
Item Details View
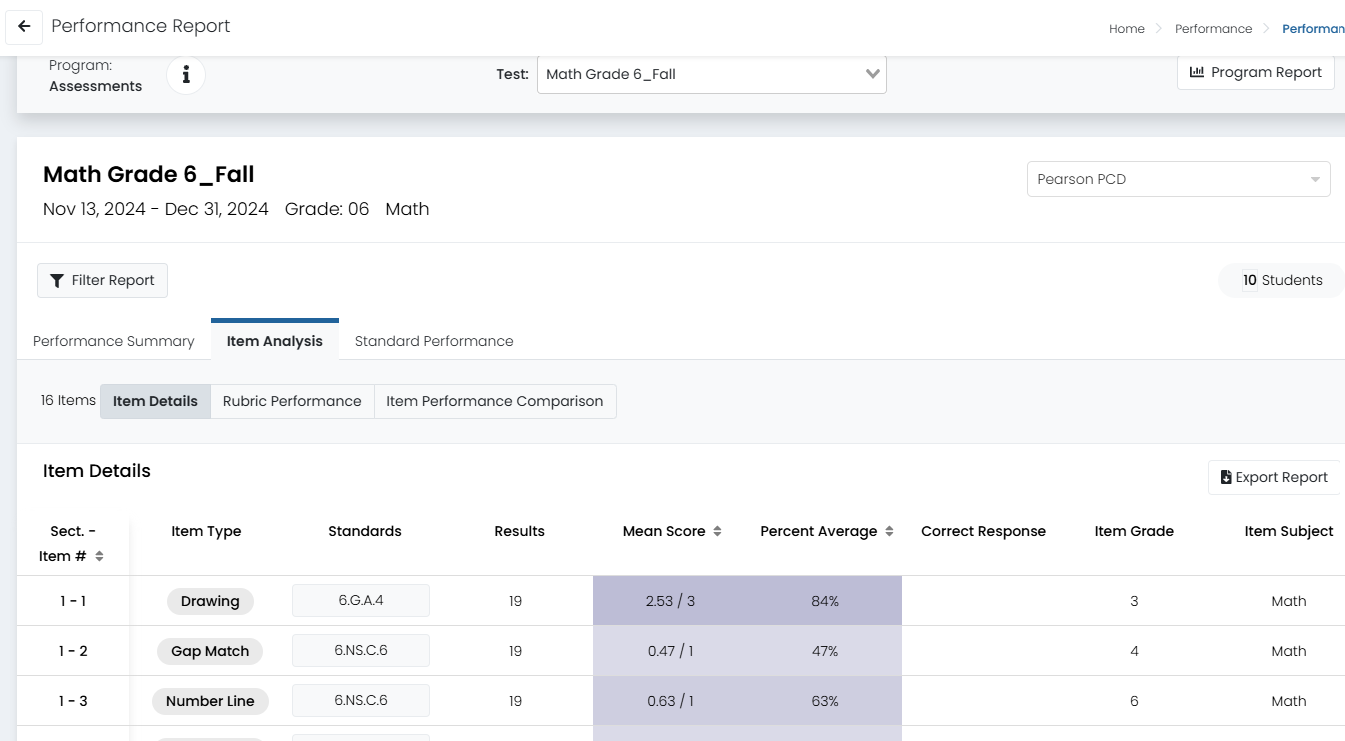
The Item Details view displays information about each item, including the primary standard, scores, and correct response. Hover over a standard to see a full description. The Mean Score column displays mean score /max score.

Sample Items Details view.
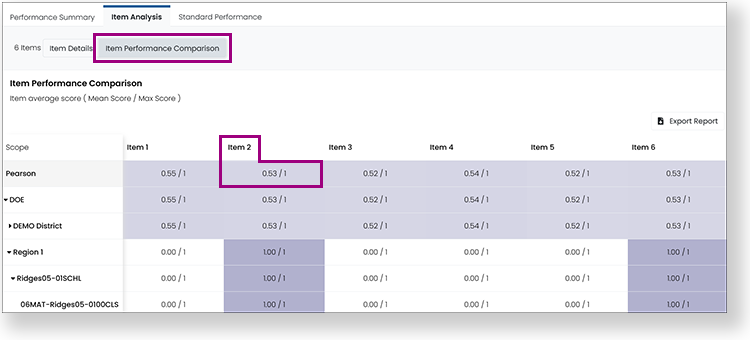
The Item Performance Comparison shows performance on each item across institutions and classes.

Sample Item Performance Comparison View

At the top of the popup, you can select the arrows or item menu to view other items in the report. Each item displays a Score Point Distribution, the number of students who achieved each point level. Most item types also have a Response Distribution; the number indicates how many students selected each response. A green checkmark indicates the correct answer. Given the large number of possible responses, these types do not have a response distribution: Text/Math Entry, Extended Text, Drawing, Audio Recorder and Graphing. Enhancements are in development for some multi-part item types to clarify the responses.
Tiny Link: https://support.assessment.pearson.com/x/lwBeCg