Some customers may have item statistics calculated based on student test results and then have that data uploaded via a CSV file into the applicable ADAM item bank by a member of the Pearson delivery team. There is a base csv template available for use for data population and upload. Contact the A&D Product Manager for assistance.
Designated users can then view a summary of statistics. Each item row is clickable and once open, displays individual item statistics across various administrations. Users can flag an admin to display on the main dashboard as well as click on the item preview, as needed.
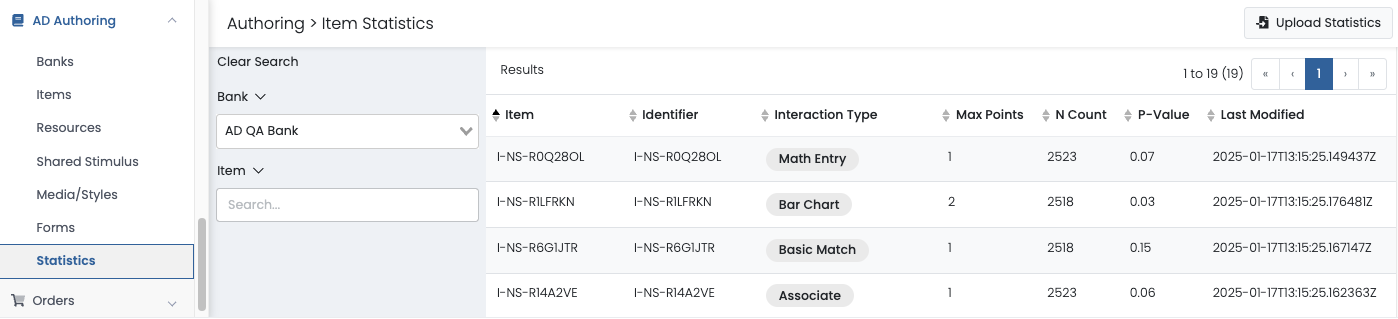
Sample Item Statistics page
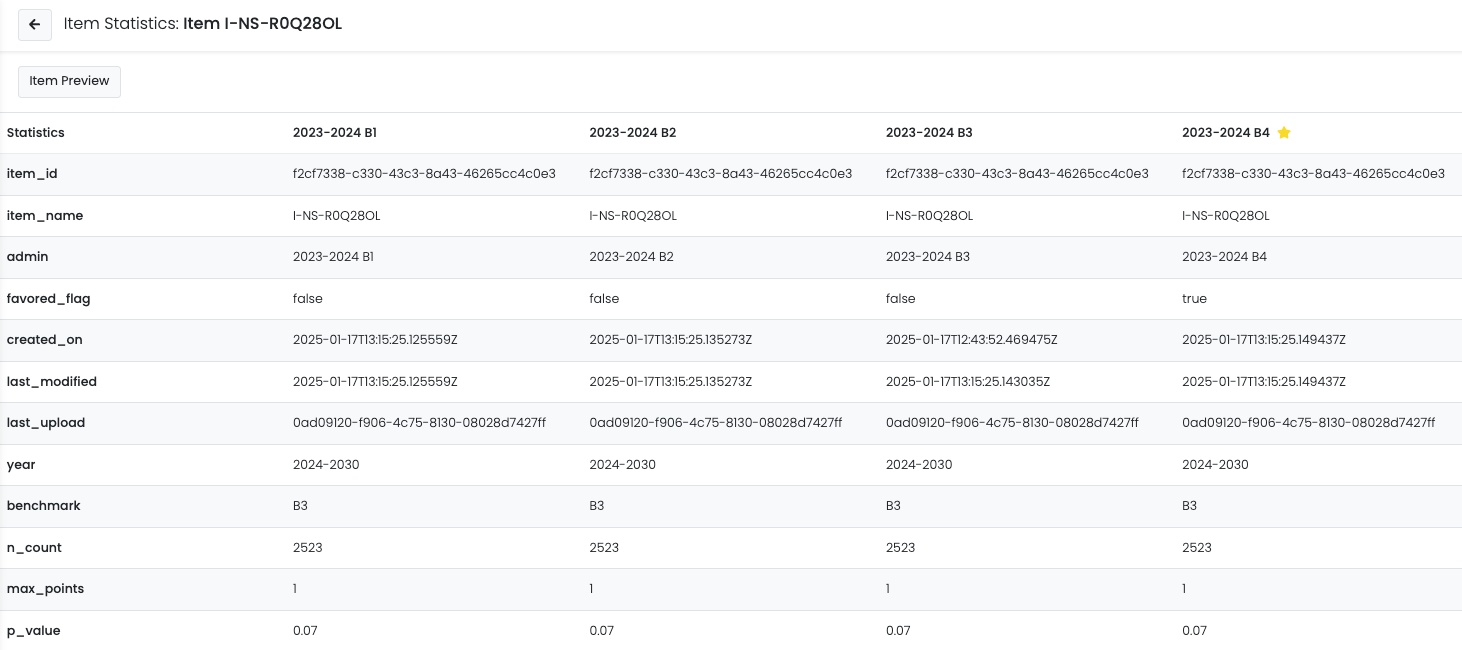
Sample Item Statistics Detail
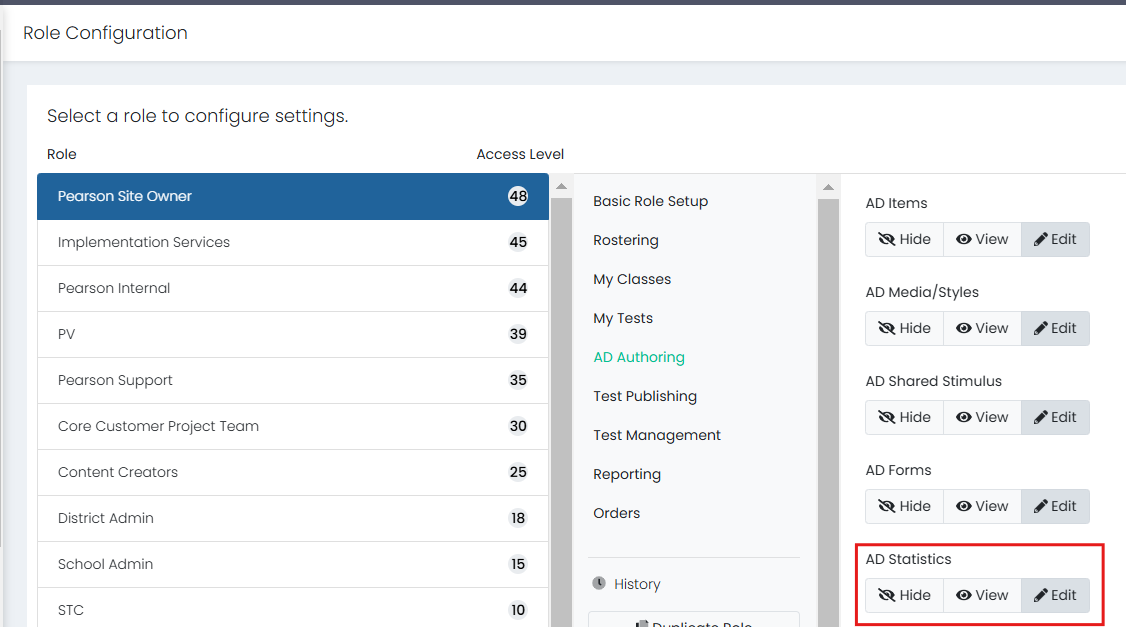
User permission needed
Track Who Updated Statistics
You can track which users uploaded statistics as well as provide a status of the upload using a the ‘Upload History’ button. Once users click the new button an ‘Upload History’ menu will appear that shows the file name, status, created by, and created date. You can download statistics.


Delete Statistics
You can delete previously uploaded statistics from an individual item. A trash can icon appears next to the header of each file that has been uploaded. NOTE: If the flagged column (indicated by the yellow star) is deleted from this view, the item will no longer appear on the main dashboard.

Download Template
From the upload screen you can download a statistics template from the UI that can be modified for upload.

Graphing
Users can generate basic graphs and tables using uploaded data attached to items. Users have an Item Graph button next to the ‘Item Preview’ on the UI once viewing individual item statistics. Clicking this will produce a graph with the statistics for 'P-Value', 'N-Count', 'Max Score' and, ‘Option Distribution’. Graph/table and percentages/numbers toggles are also available.

